Monument Quickstart Guide
Predict equity price levels based on historical data
This simple tutorial will demonstrate how to create a predictive model with Monument. This model will be extremely simple. It is primarily intended to showcase how easy it is to create and share sophisticated statistical models without code.
We will predict equity prices within the insurance industry based on historical data of multiple competing companies.
Before we begin:
- Download and install the Monument app on your computer
- Click the Monument icon to launch the software
Step 1: Loading Data
The first part of any workflow is loading data.
Click the CSV button to open the file explorer. You can load your own CSV or use our pre-loaded sample datasets.

Let's select insure.csv from our pre-loaded sample data.

After opening the file, you will see two representations of the data:
- the data as it appears in the source file on the top part of the screen, and
- the data as it will be represented within Monument on the bottom part of the screen, including name and type
You can edit the data type by clicking the type below the column header.

You can also edit column names in the import screen.
When you are satisfied with the import, click Ok in the bottom right-hand corner of the screen to complete the data loading step.

Step 2: Analyzing Data
In the Model workspace, you can see the data you imported represented as "data pills" on the left-most column.

Drag the AIG data pill to the ROWS (Y) area of the workspace to plot AIG.

You can see how values within two columns are related, by dragging another column in the COLS (X) area.
Let's drag MET over there.

Because we want to predict the future value of AIG, let's replace MET with Date in the COLS (X) area.

Let's try our first algorithm. Drag the AR algorithm into the ROWS (Y) area to generate a prediction.

In addition to seeing the prediction in the chart area, you'll notice a "loss rate" report in the bottom left-hand portion of the screen. This provides insight into how accurate the algorithm was when training itself on historical data. This gives you a clue as to its reliability when generating predictions into the future.
The information displayed here will be different depending on the algorithm, as different algorithms have different ways of reporting this information.
Let's try adding a second algorithm.

Now that we have two predictions on AIG, let's also plot PRU from the data area.

We can repeat the prediction process for PRU.
Note that when you have multiple data pills plotted, you must drag algorithm pills directly on top of the data pill you want to predict.

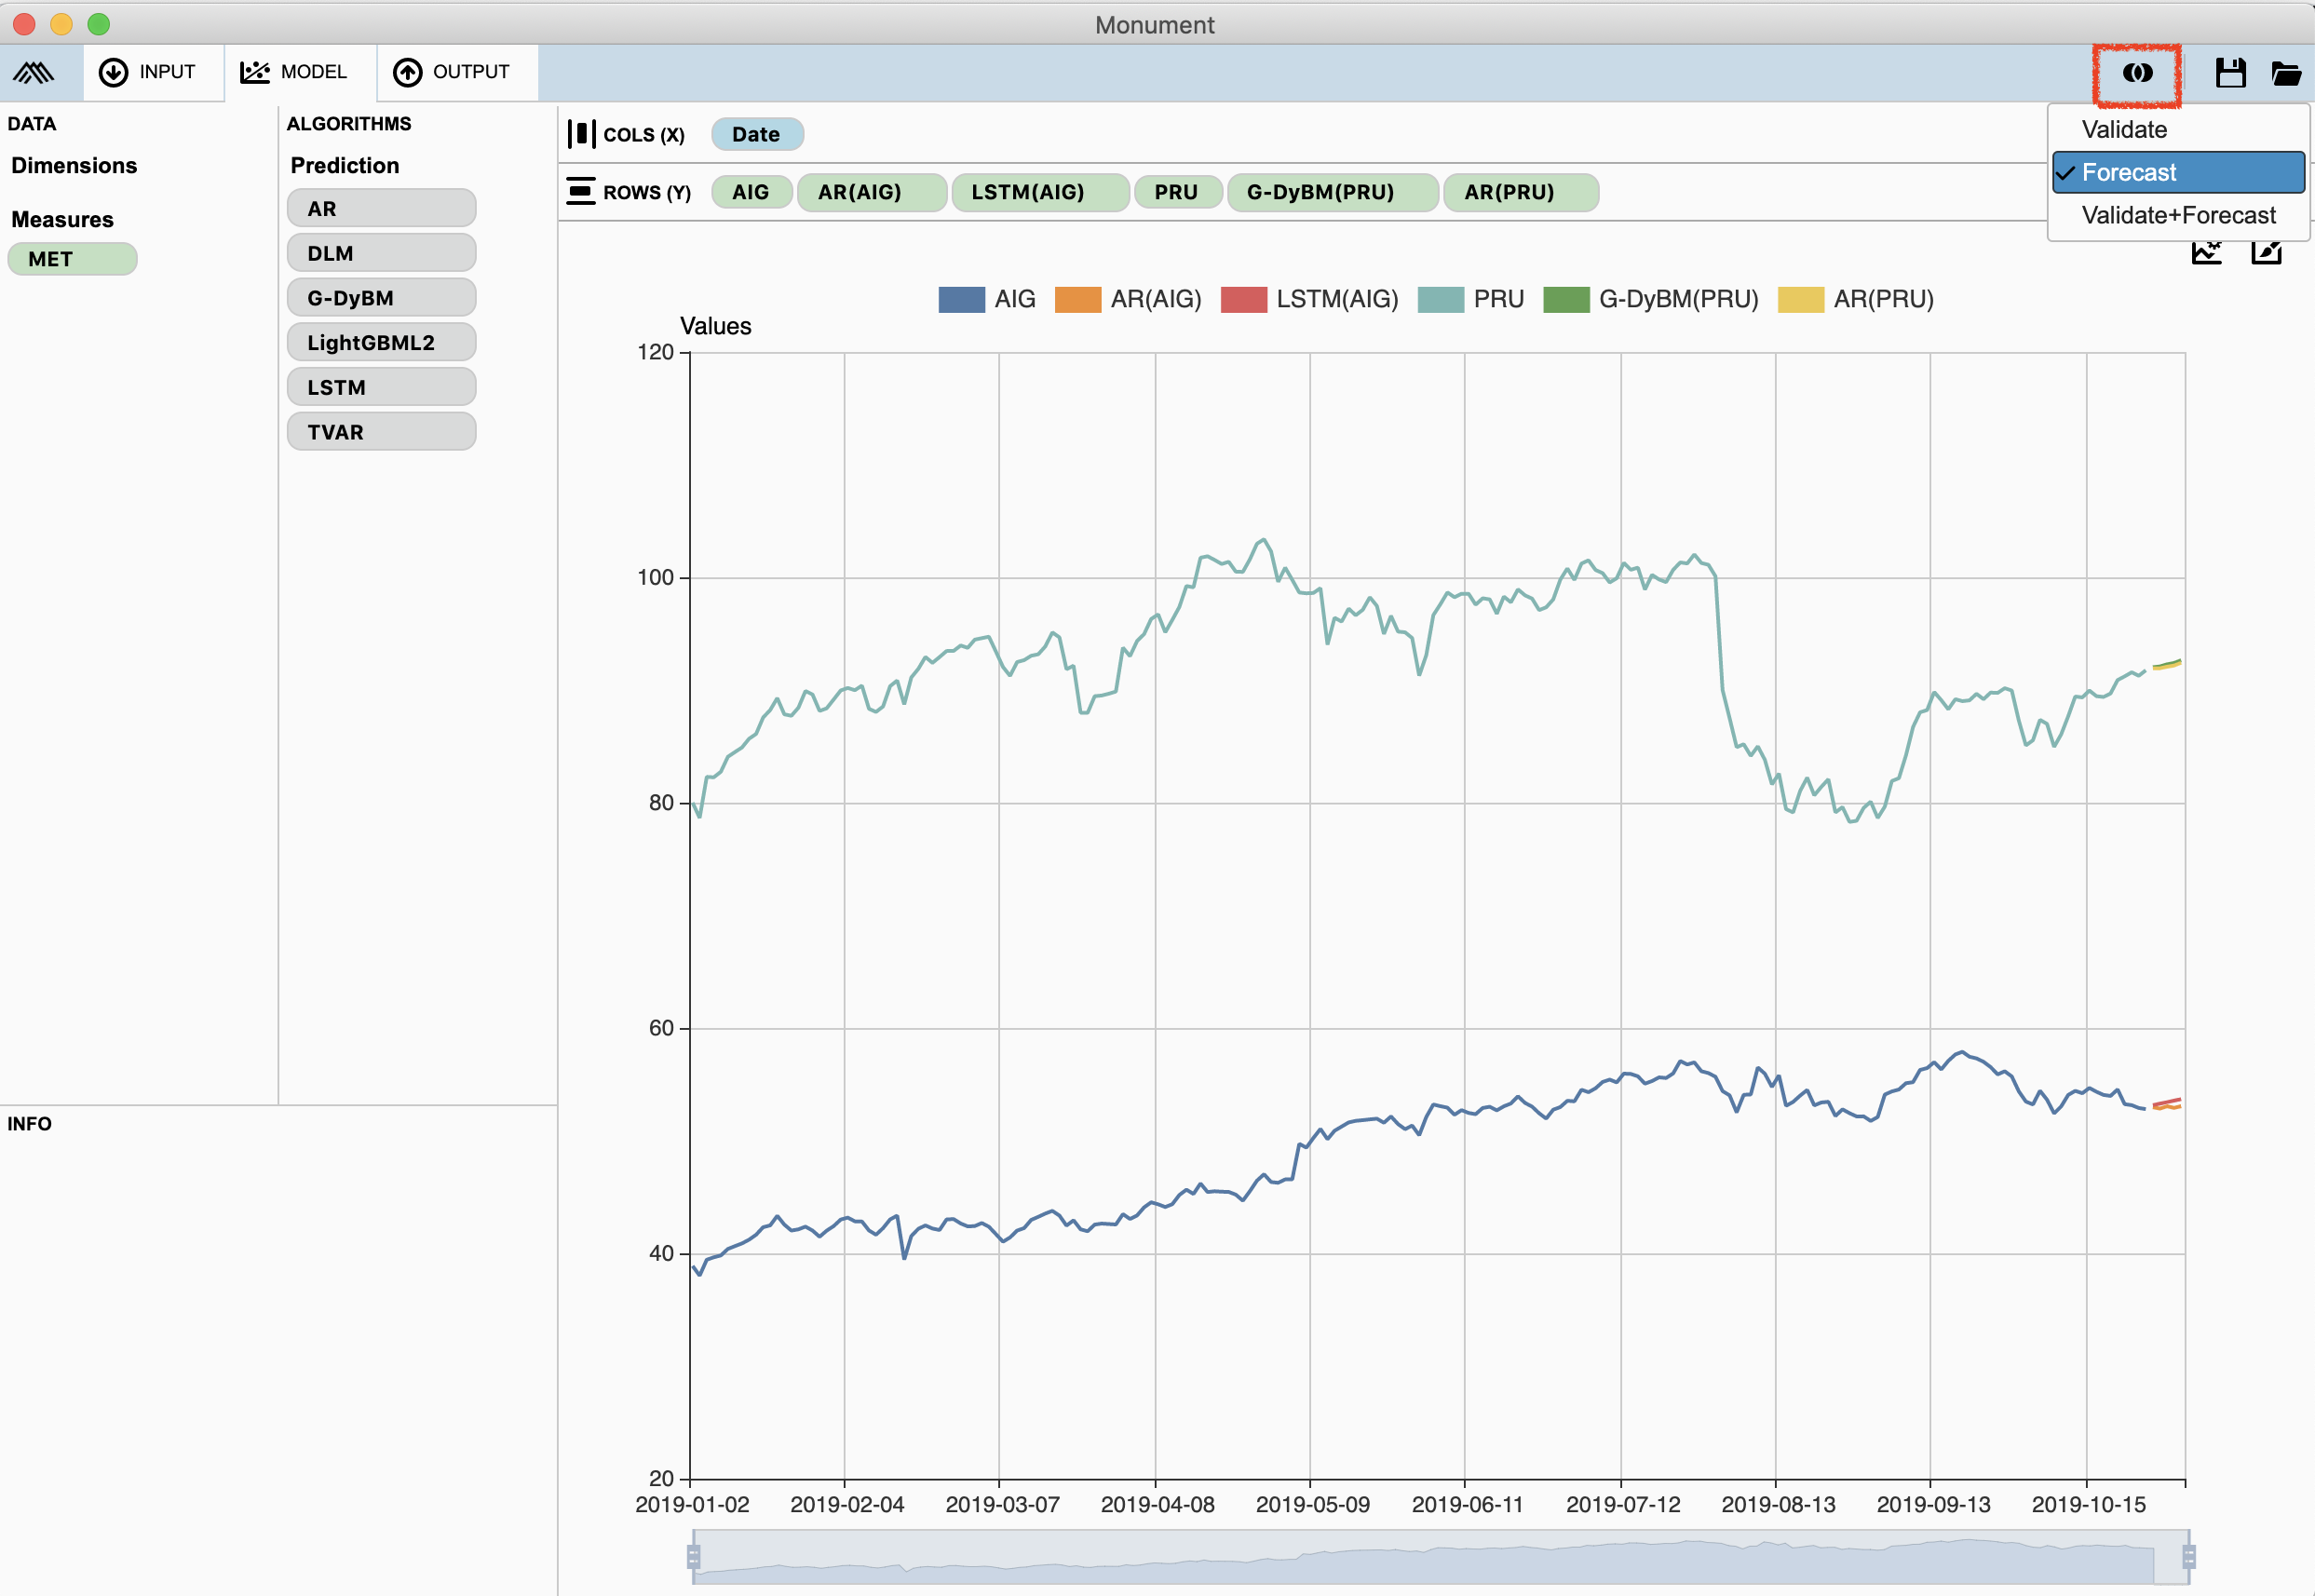
In the top part of the screen, there is a button that allows you to toggle between displaying only the training, only the forecast, or the training and the forecast together.

In the top right corner of the chart area, there is a button that allows you to modify how the information is charted.

This is the same chart, but with the values normalized.

Step 3: Saving Output
You can save your project as a .mai file by clicking the save icon at the very top of the window. This file contains your original data and your model. You can reload it and share it with anyone using Monument.

If you move to the Output tab and scroll to the bottom, you will see the predictions represented in table format.
The p1, p2, etc. notation stands for Period 1, Period 2, etc. These will vary based on the periodization of the input data. If it is weekly data, each forecasted period will be one week. If it is daily data, each forecasted period will be one day.

You can export this table as a .csv file.

Congratulations! You have completed your first model with Monument!